Hack-a-thon 2022
In the MSCI 758 class Marine Data Science with R taught by Dr. Erin Meyer-Gutbrod, students learn basic programming skills, version control and collaborative coding practices with git and GitHub, dynamic programming notebooks, data cleaning and visualization techniques, statistical tests and models, spatial analysis and mapping. These skills are learned by analyzing a wide range of data sets, including climate indices (global temperature, atmospheric CO2, and ice melt), seafloor bathymetry, ocean primary production from satellites, penguin anatomy, fisheries stock assessment, spatial management boundaries and AIS ship tracks. In addition to honing these skills, students are asked to analyze a dataset to address a societal problem in a week-long hack-a-thon. Potential topics are identified by students and the final topic is chosen through a class vote. The goal of this class exercise is to familiarize students with the practice of using scientific skills to address real world problems. The analysis is made public to raise awareness about critical societal problems and to showcase the excellent work that is done by graduate students and upper-level undergraduates at the University of South Carolina.
Note: The following analysis should be treated as a class exercise and not an analysis that has undergone rigorous review by field experts.
Note: The following analysis should be treated as a class exercise and not an analysis that has undergone rigorous review by field experts.
2022 Hack-a-thon theme: Waterbody Impairment in South Carolina
The Spring 2022 MSCI 758 class decided to analyze the South Carolina 303d list of impaired waters. The primary dataset comes from the 2018 list published by the SC Department of Health and Environmental Control: https://scdhec.gov/bow/south-carolina-303d-list-impaired-waters-tmdls.
Historical 303d lists and water basin shapefiles were sourced from DHEC as well.
Website Contributors (listed alphabetically):
Ben Aland, Maggie Bernish, Paul Ernst, Maggie Gaspar, Gwen Hopper, Maddy Janakis , Chloe Keck, Abby Kreuser, Birch Lazo-Murphy, Levi McKercher, Darcy Perin, Amadi Afua Sefah-Twerefour, Nick Steichmann, Kira Telford, Madeleine Thompson
The Relationship between Priority, Use, and Cause in Impaired South Carolina Waters between 2016 and 2018
The South Carolina Department of Health and Environmental Control (SCDHEC, or DHEC) publishes a list of impaired waters every 2 years as per the Federal Clean Water Act (Marcus, 2020). These are determined by a combination of state and federal standards, with data obtained from a wide variety of sources, including beach monitoring stations, water quality assessments, and surveys of populations of bacteria, macroinvertebrates, and so forth. Of these waters that are considered impaired, or harmed in their intended use by some cause, each is assigned a Priority Rank from 1 to 3, with 1 being the highest priority and 3 being the lowest. The highest priority waters are intended to be addressed the soonest, with lower-priority waters taking longer to be fully addressed. Since these priority ranks are not empirically determined, it is useful to analyze them to ensure that the arbitrary nature of their selection has not failed to address certain geographical areas, causes of impairment, or uses of water bodies.
In this study, we use the latest impaired water body assessments for 2016 and 2018 and divide them by location, priority rank, use, and cause in order to determine where the SCDHEC is focusing its resources and where it might allocate them better in the future. To begin our investigation, we map the water bodies of South Carolina by whether or not they are impaired (Figure 1).
In this study, we use the latest impaired water body assessments for 2016 and 2018 and divide them by location, priority rank, use, and cause in order to determine where the SCDHEC is focusing its resources and where it might allocate them better in the future. To begin our investigation, we map the water bodies of South Carolina by whether or not they are impaired (Figure 1).
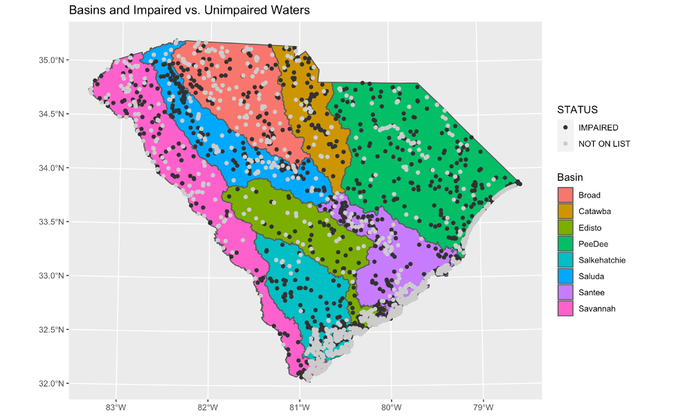
Figure 1: Waters listed in the impaired data versus not listed as impaired per each basin in South Carolina.
We find that the vast majority of coastal waters are not impaired, while mid-state waters tend to be more impaired than not. The Catawba and PeeDee basins are particularly noteworthy for a high ratio of impaired to unimpaired interior waters.
We find that there is a vast decrease in the number of high priority (rank 1) waters from 2016 to 2018, with a total of 60 entries in 2016 compared to 1 in 2018. Of those high priority waters, 2/3 (40) of them are in the Catawba basin. By contrast, there is an increase in rank 2 waters from 55 entries in 2016 to 79 in 2018. The plurality (21) of these entries are in the Saluda basin in 2016, with this number increasing by 6 to 27 entries in 2018. Notably, most of the Catawba basin watersheds that were rank 1 in 2016 are reclassified as rank 2 in 2018, with 46 entries in total. From this, we can conclude that either a concerted effort has been made in the Catawba basin specifically to address high priority waters, or that the priority of these waters has been downgraded.
Next, we examine the relationship between Priority Rank and Use:
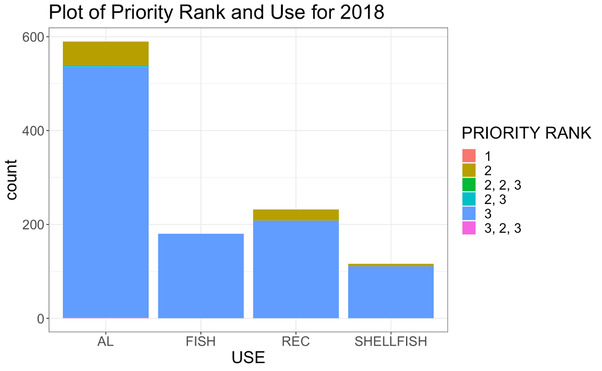
Figure 2: Use of different impaired waters, colored by Priority Rank, 2018. Multiple ranks indicate a sequence of rankings over time from multiple readings over the study period.
About half of all waters are used for AL, or Aquatic Life, listed in the 2018 report submitted by the state of South Carolina to the EPA as waters whose goal is to propagate a “balanced indigenous aquatic community of fauna and flora.” The rest of the major uses listed are for fishing, shellfish, and recreation. We note that no fishing-use-related waters are impaired beyond rank 3, and that the highest absolute number of water bodies that are impaired are used for aquatic life. That stated, the relative fractions for impaired waters at rank 2 are comparable between aquatic life and recreation, with a smaller proportion in shellfish usage.
We continue by examining the priority rank as related to the cause of impairment:
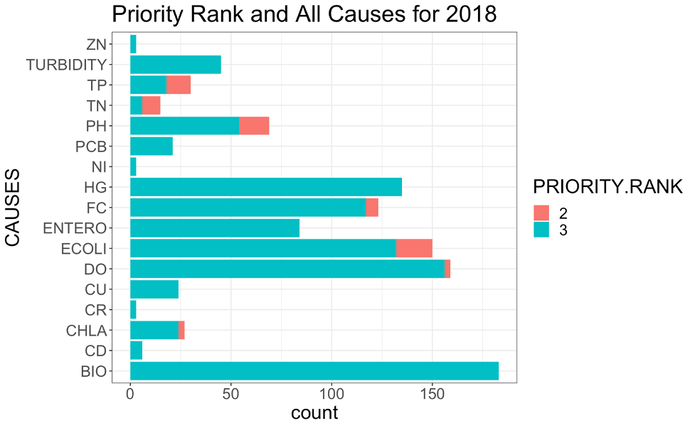
Figure 3: Cause of different impaired waters, colored by Priority Rank, 2018.
Kruskal-Wallis chi-squared = 11.871, df = 1, p-value = 0.0005702
We find that the overwhelming cause of impaired waters as a whole is due to adverse macroinvertebrate activity (BIO) and bacteria (E-coli/enterococci/Fecal Coliform, ECOLI/ENTERO/FC). Following behind direct biological impairment is dissolved oxygen (DO) and mercury (HG) with a smaller set of waters impaired by pH imbalances and turbidity concerns. In proportion to the total number of waters impaired, the most waters heavily impaired (priority rank 2) belongs to total phosphorus (TP) and total nitrogen (TN). We used a Kruskal-Wallis rank sum test to determine if the groups (priority ranks 2 and 3) are significantly different. With 1 degree of freedom and a chi-squared value of 11.871, we arrive at a p-value of 0.0005702, which means that we reject the null hypothesis. In this case, our alternative hypothesis/conclusion is that the two ranks are significantly different between the causes that we see above, which matches our analysis.
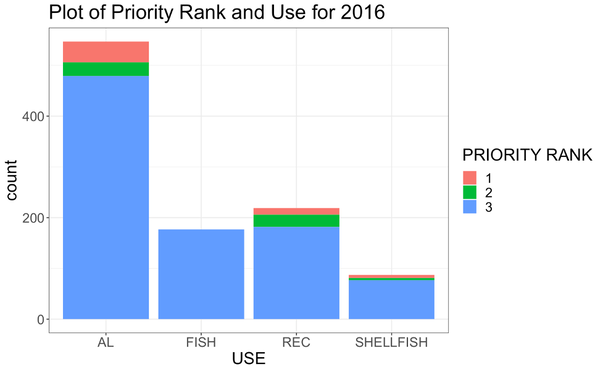
Figure 4: Use of different impaired waters, colored by Priority Rank, 2016.
Figure 4 shows us that AL and REC dominated the impaired waters in 2016 by both total number and number of heavily impaired waters. The only major difference is in the splitting of the large section of priority rank 2 waters in 2018 into rank 1 and rank 2 waters in 2016. In this manner, AL has more rank 1 waters than rank 2 waters, while the inverse is true for REC. Additionally, it must be noted that a larger total of waters were impaired in 2018 than 2016.
Figure 4 shows us that AL and REC dominated the impaired waters in 2016 by both total number and number of heavily impaired waters. The only major difference is in the splitting of the large section of priority rank 2 waters in 2018 into rank 1 and rank 2 waters in 2016. In this manner, AL has more rank 1 waters than rank 2 waters, while the inverse is true for REC. Additionally, it must be noted that a larger total of waters were impaired in 2018 than 2016.
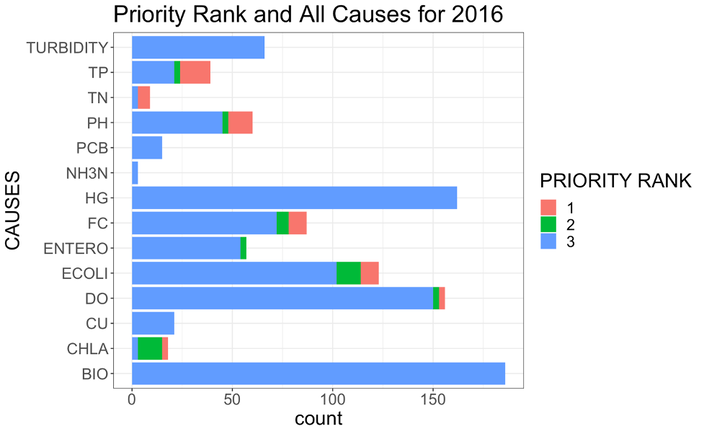
Figure 5: Cause of different impaired waters, colored by use, 2016.
Kruskal-Wallis chi-squared = 11.068, df = 2, p-value = 0.003951
The notable changes in total causes between 2016 and 2018 are as follows: from 2016 to 2018, FC, PH, E-coli, and DO increased, while HG decreased and others remained largely the same. We can conclude that the newly impaired waters are primarily due to bacteria and nutrient flux. We observe that a disproportionate number of priority rank 2 waters are impaired by Chlorophyll-a (CHLA) in 2016, even though there are fewer overall waters impaired by CHLA in 2016. Otherwise, the ratio of more heavily impaired waters (ranks 1 and 2) are comparatively similar, although there are an appreciable number of rank 1 waters in both bacterial (FC, ECOLI) and chemical (TP, TN, PH) causes. In fact, TN has more rank 1 waters than rank 3. As we expect from this highly variable distribution, we do have a significant difference between our rank distributions with a p-value of 0.003951 (Kruskal-Wallis rank sum test).
Conclusion
In this analysis, we have examined the relationship between total impaired waters, their locations, priority ranks, uses, and causes between 2016 and 2018. We have found that the majority of heavily impaired waters are inland and clustered into a few basins (Catawba, Peedee, Saluda) in both reports. However, we note that only one water body in 2018 is classified as priority rank 1. We find this is most likely a mass change of Catawba priority 1 waters. Impaired waters increase between 2016 and 2018. Of all main uses and causes, we attribute this to an increase in bacterial impairment in recreational areas as well as nutrient impairment in aquatic life areas. Other major causes, including macroinvertebrates and turbidity, remain relatively constant throughout the period. Future rankings, particularly the 2020 list, will be released this year in 2022.
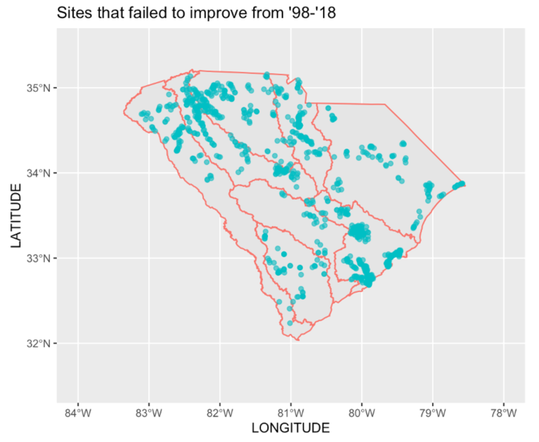
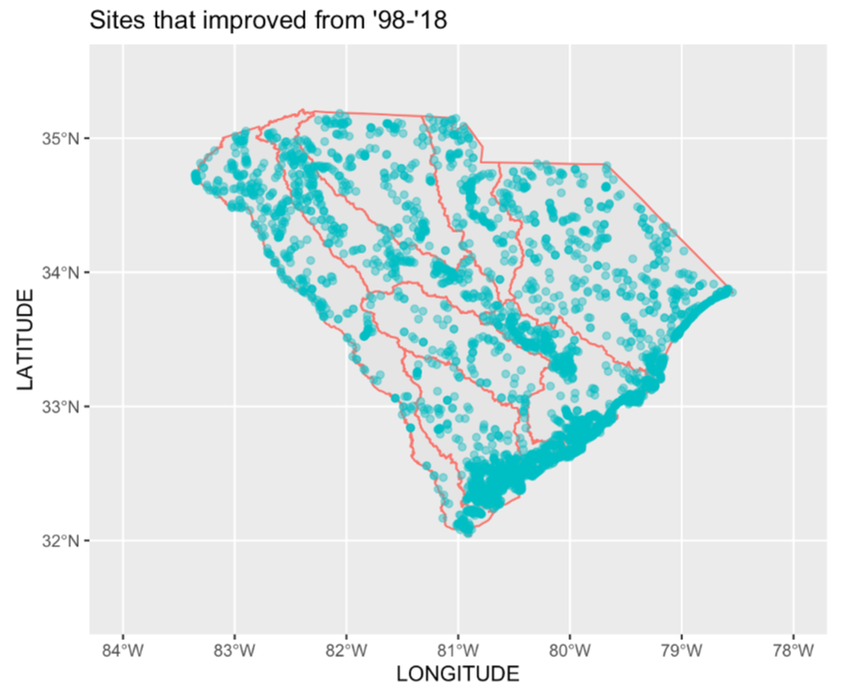
Water impairment from 1998-2018
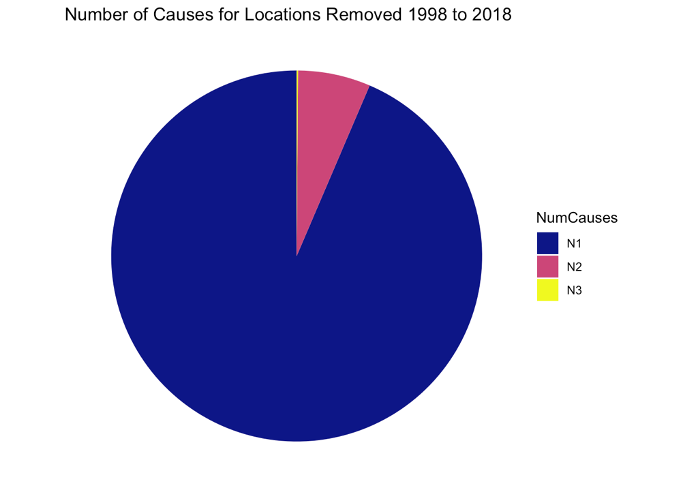
These maps show the stations that failed the water quality tests for a variety (or in some case up to eight). The first map shows which sites failed to improve and pass the tests and remained on the fail list between the period 1998 and 2018. The second map shows the sites that did improve over the same 20 year period. Total amount of stations that failed to improve was staggeringly high at 1102. Total amount of stations that passed were also high at 3540. Stations that went from passing to failing over the 20 year period were totaled at 2894. Four total stations failed with 8 separate causes.
|
|
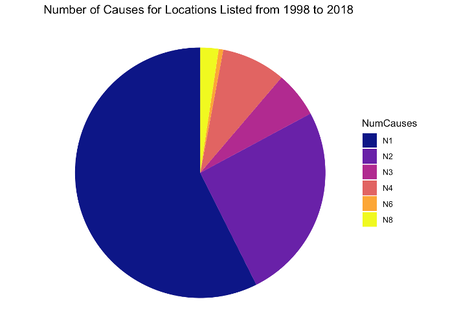
The goal of these figures is to be able to easily visualize improvements to water bodies over time. The first pie chart shows the fraction of locations which have not been removed over the 20-year period 1998 to 2018. They are grouped by the number of causes which have caused each respective location to be on the list. The majority of locations have made the list due to a single issue, and have remained there for 20 years, however, in four locations over eight issues have persisted. These locations are 1) Magnolia Gardens, a former plantation, 2) Kingston Lake, which is next to a recycling plant, 3) McApline Creek, which is next to a construction facility that specializes in retention walls, 4) Reedy River, which is to the southeast of a wetland (nature’s kidneys). The second pie chart shows the fraction of locations which have been removed over the 20-year period. The overwhelming majority of the water bodies have only had one issue to deal with. Water bodies with multiple issues are harder to remediate as they require more complex strategies. The final pie chart shows the fraction of water bodies that have been added over the 20-year period. Most of these water bodies only have one issue - this is likely just a function of increased monitoring of water bodies.
|
|
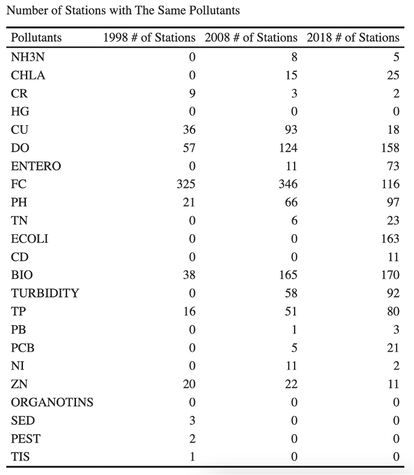
Impairment causes in 1998, 2008 and 2018
Next, we aimed to visualize the major pollutants found in each basin for 1998, 2008 and 2018. The second goal was to make a table stating the numerical values of the number of stations with the same pollutant for 1998, 2008, and 2018. This is important because it allows us to see if specific pollutants persist for the 20 year period. Based on the graphs, it can be seen that Fecal Coliform Bacteria is the greatest pollutant, but the amount of stations it effects has significantly decreased between 2008 and 2018. Another trend is that 2018 has the most variety of pollutants, and there is an increase in almost every pollutant between 2008 and 2018. This may be due to either and increase in pollution, or an increase in the amount of testing done to detect the pollutants.
Next, we aimed to visualize the major pollutants found in each basin for 1998, 2008 and 2018. The second goal was to make a table stating the numerical values of the number of stations with the same pollutant for 1998, 2008, and 2018. This is important because it allows us to see if specific pollutants persist for the 20 year period. Based on the graphs, it can be seen that Fecal Coliform Bacteria is the greatest pollutant, but the amount of stations it effects has significantly decreased between 2008 and 2018. Another trend is that 2018 has the most variety of pollutants, and there is an increase in almost every pollutant between 2008 and 2018. This may be due to either and increase in pollution, or an increase in the amount of testing done to detect the pollutants.
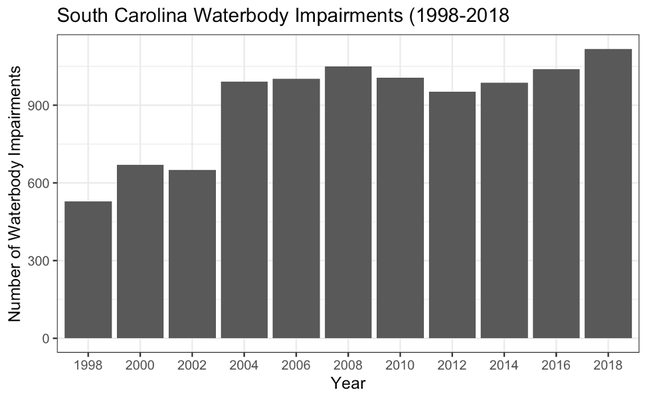
Waterbody Impairment Time Series (1998 - 2018)
In general, the number of waterbody impairments in South Carolina has been increasing over time. One major cause of this is the testing capacity of state agencies like the South Carolina Department of Health and Environmental Control (SC DHEC). As more waterbodies are tested, the overall number of impaired will increase. Another potential cause for waterbody impairment is that much of the state is experiencing changes in land use. As natural swamps or forested lands are converted to industrial or agricultural areas, more chemicals, both common and emergent, are entering aquatic systems, potentially causing impairments.
There was a noticeable increase (52%) in the number of impaired waterbodies between 2002 and 2004. According to the 2004 water quality Report by SC DHEC, the waterbody impairment guidelines, “SC Regulation 61-68, Water Classifications Standards” were amended, effective June 2001. This change imposed restrictions on total phosphorus, total nitrogen, turbidity, and chlorophyll-a criteria for lakes. The amendment also changed metal criteria in freshwater. While these changes were enacted in 2001, there may have been an observed lag in regulation.
There was a noticeable increase (52%) in the number of impaired waterbodies between 2002 and 2004. According to the 2004 water quality Report by SC DHEC, the waterbody impairment guidelines, “SC Regulation 61-68, Water Classifications Standards” were amended, effective June 2001. This change imposed restrictions on total phosphorus, total nitrogen, turbidity, and chlorophyll-a criteria for lakes. The amendment also changed metal criteria in freshwater. While these changes were enacted in 2001, there may have been an observed lag in regulation.
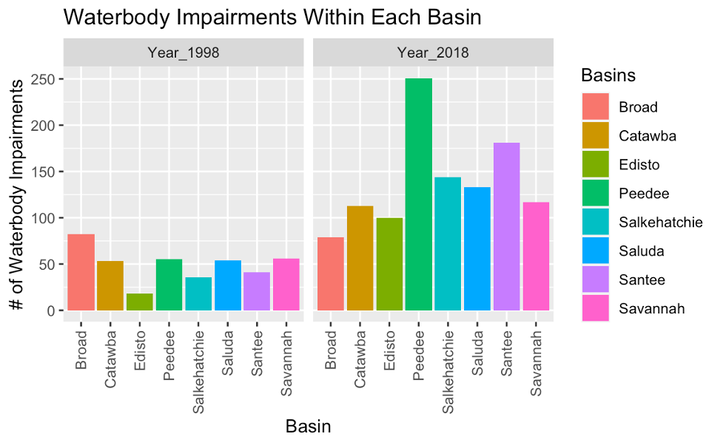
The figure above shows that the number of waterbody impairments in the state of South Carolina has largely increased for 7 of the 8 major river basins within the state. The Broad River basin is the only exception. This is likely attributed to more strict water quality standards at present compared to 1998 water quality standards, however increased rates of urbanization and agricultural intensity may have caused negative water quality effects within SC waterbodies.
We created a map of the ratio of area of water/total area of county. This can help explain the distribution of priority ranks and why some counties possess far greater impairments than others.
We created a map of the ratio of area of water/total area of county. This can help explain the distribution of priority ranks and why some counties possess far greater impairments than others.
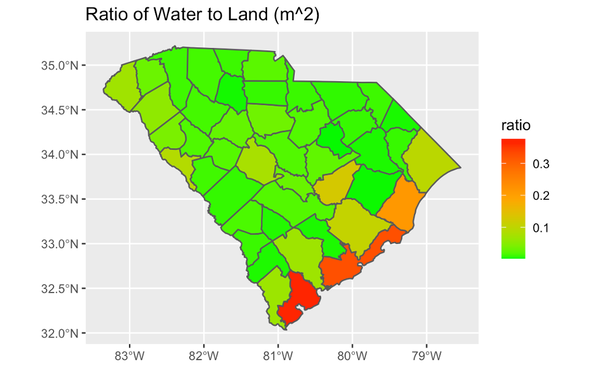
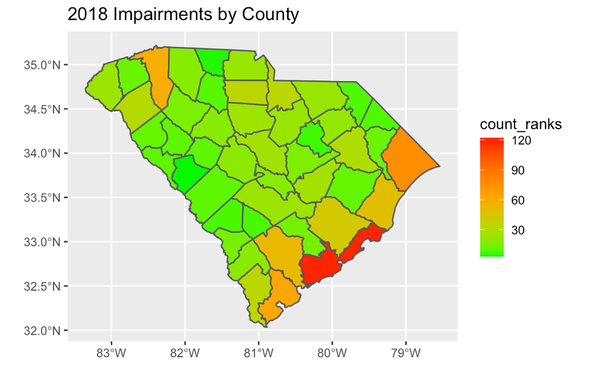
The following figure shows the number of impairments by county for 2018. The coastal counties, as illustrated by the water ratio map, possess the highest number of impairments which is what we would expect. Interestingly, Greenville county has a high number of impaired waterbodies but a low ratio of water to land.
South Carolina Case Study of Waterbody Improvement
Coneross Creek and Beaverdam Creek
Fecal coliforms (FCs) are the number one cause of waterbody impairments in the state of South Carolina (349 impairments in 2018). These bacterium emerge in human, livestock, or wildlife feces, and can be transported as nonpoint source pollution following large rainfall events. Major sources of FCs include livestock operations and failing septic systems in rural areas. A combination of these two sources resulted in the impairment of the Coneross Creek and Beaverdam Creek (below) in Northwest South Carolina in 1998. Consequently, both creeks were placed on the South Carolina Dept. of Environmental Health Control (SC DHEC) 303d list of impaired waters in 1998 and deemed high priority waterbodies.
Fecal coliforms (FCs) are the number one cause of waterbody impairments in the state of South Carolina (349 impairments in 2018). These bacterium emerge in human, livestock, or wildlife feces, and can be transported as nonpoint source pollution following large rainfall events. Major sources of FCs include livestock operations and failing septic systems in rural areas. A combination of these two sources resulted in the impairment of the Coneross Creek and Beaverdam Creek (below) in Northwest South Carolina in 1998. Consequently, both creeks were placed on the South Carolina Dept. of Environmental Health Control (SC DHEC) 303d list of impaired waters in 1998 and deemed high priority waterbodies.
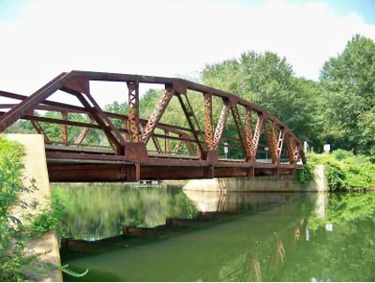
Beaverdam Creek; Source: Michael Miller, August 2013
Total maximum daily loads (TMDLs) for FCs were established for Beaverdam Creek in 2000 and Coneross Creek in 2002. The TMDLs determine a set amount of FCs that can enter the creeks while still allowing them to meet their intended uses, which in the case of Beaverdam and Coneross Creeks, are recreational uses. TMDL establishment allowed for the creeks to be removed from the 303d list; however, a management plan was required to reduce the amount of FCs that were entering these creeks in the past. A collaborative team comprised of the SC DHEC, Clemson University, United States Dept. of Agriculture-Natural Resource Conservation Service, Oconee County Soil and Water Conservation Service, and Oconee County Cattlemen’s Association implemented and completed a $1.1 million dollar project to restore the water quality of Coneross and Beaverdam Creeks. The project focused on community education, restoration of failed septic systems, and best management practice (BMP) installation within the 47,016 acre Coneross Creek watershed and the 9,099 acre Beaverdam Creek watershed. In 2005, both creeks succesfully met their TMDLs and have been restored to meet their intended recreational use.
This is just one of the many success stories of how water quality is being improved in South Carolina’s waterbodies. However, there were 1,238 waterbodies listed on the 2018 SC DHEC 303d list, a number which is likely to increase for the 2020 303d list. Funds must be allocated equitably across the state and stakeholders must be willing to work together to solve the pervasive problem that is nonpoint source pollution. This is a mighty task, but one that can be achieved if we South Carolinians prioritize the health of our waterbodies and hold each other accountable!
Relationship between impairment causes, use and priority rank in 2018
The 303d list identifies impaired water bodies within each state, listing uses of the water body and causes of impairment. The goal of our project was to understand the relationship between priority ranking and impairment with respect to basin, use, and cause. We created bar plots and heat maps to compare the impaired water bodies and their priority rankings in the categories previously mentioned. We investigated and visualized the causes of impairment, to better understand impairment in relation to basin and use.
We hypothesized that basins with an increased number of impaired waters due to a multitude of causes would rank higher in priority. To test this hypothesis, we looked for relationships between priority ranking with respect to utilizing data from the 2018 303d list to disseminate trends.
Priority ranks
The priority ranks are defined as:
1 = Current Priorities are those site/pollutant combinations being addressed by TMDL or alternative restoration plans being developed during the 2016-2018 time-frame.
2 = Near Term Priorities are those site/pollutant combinations being addressed by TMDL or alternative restoration plans being developed during the 2019-2022 time-frame.
3 = Long Term Priorities are those site/pollutant combinations being addressed by TMDL or alternative restoration plans being developed after 2022.
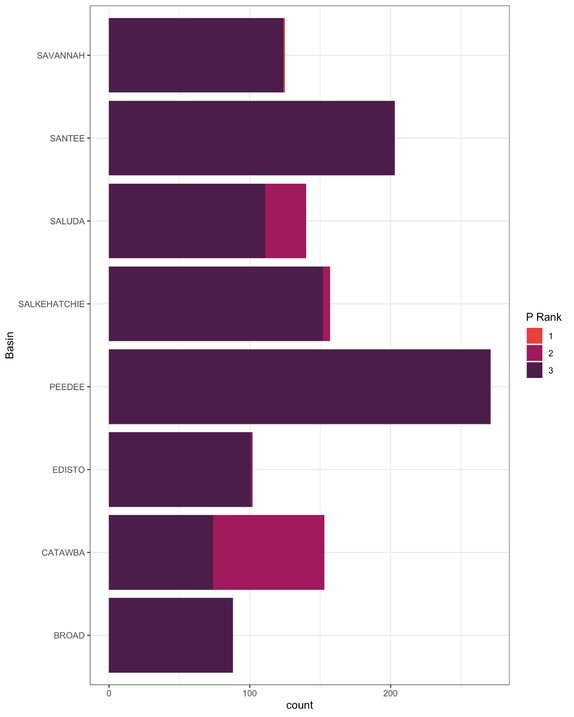
From the above figure, we see that the number of priority rankings ranges from approximately 80 in the Broad basin to about 280 for the Pee Dee. We also observed that the Catawba has a larger number of higher ranked waters than any other basin. Finally, we observed that most of the water bodies within each basin have been listed as priority 3. Our next steps were to examine how much of each basin hosts impaired water bodies and to look at uses and causes of impairment.
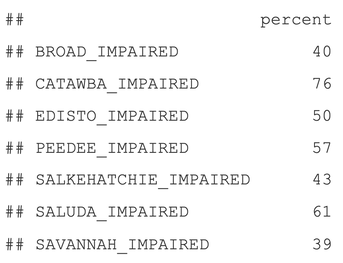
From the above table, we see that the percent impairment for South Carolina basins ranges from 39% to 76%. The Catawba has the largest percent of impaired water bodies which corresponds with this basin also having the highest number of priority 2 rankings. Seeing that priority rankings do not completely reflect percent impairment for each basin, our next step was to examine the relationship between priority rank and use.
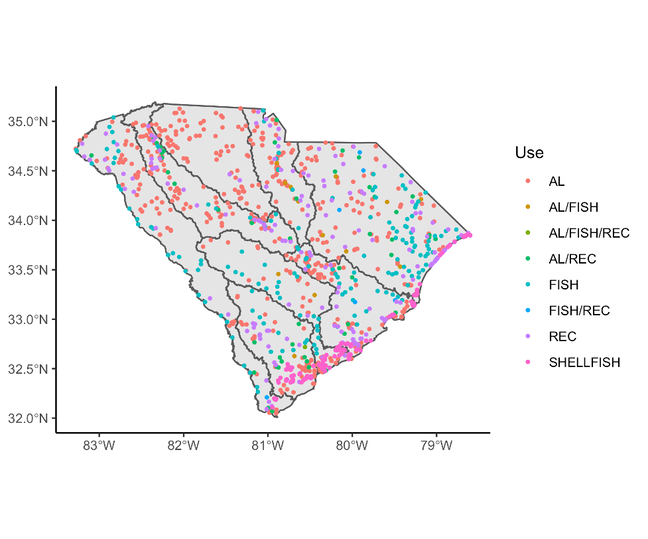
Figure 18. Uses of all sites assessed for 2018 303d list. The basin regions are outlined in dark grey.
USE can either be SHELLFISH, referring to shellfish consumption; REC, referring to recreational use such as swimming; FISH, referring to fish consumption; or AL, referring to aquatic life.
USE can either be SHELLFISH, referring to shellfish consumption; REC, referring to recreational use such as swimming; FISH, referring to fish consumption; or AL, referring to aquatic life.
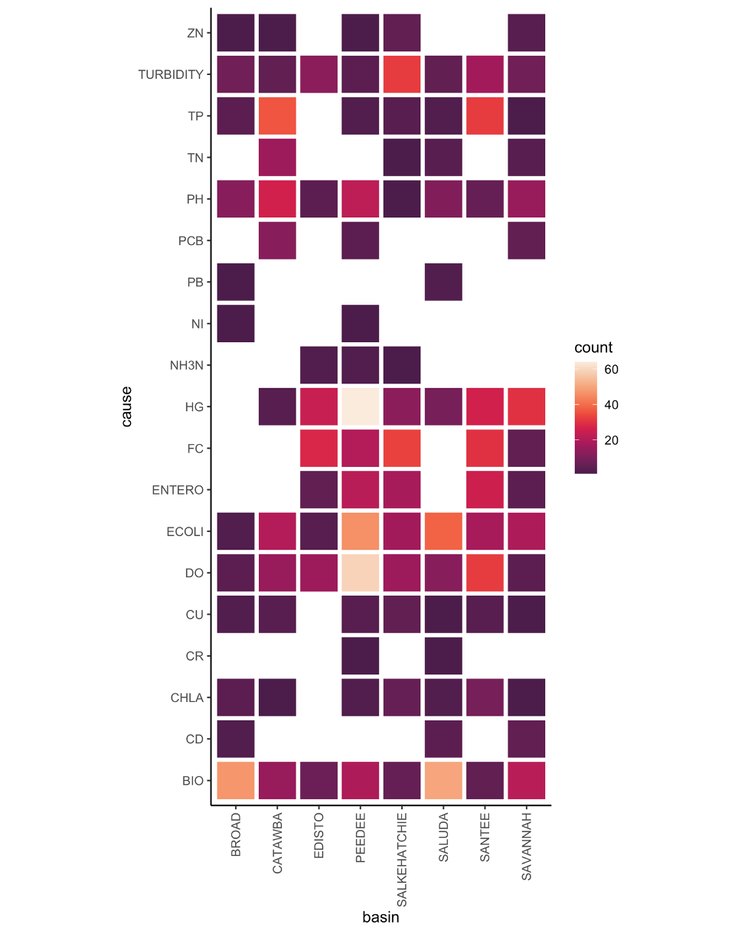
Figure 19. Heat map of the various pairs between causes and basins of impaired water bodies.
This heat map highlights the variation of frequency by cause between each basin. The Peedee basin has over 60 impaired bodies associated with mercury (HG), as well as 50-60 bodies associated with dissolved oxygen (DO). Both the Broad and Saluda basins have high counts of impaired bodies associated with biological causes (BIO). The most prevalent causes - biological (BIO), mercury (HG), dissolved oxygen (DO), and Escherichia coli (ECOLI) - vary in frequency among the basins. Management plans by use and basin may be an efficient mode of planning.
This heat map highlights the variation of frequency by cause between each basin. The Peedee basin has over 60 impaired bodies associated with mercury (HG), as well as 50-60 bodies associated with dissolved oxygen (DO). Both the Broad and Saluda basins have high counts of impaired bodies associated with biological causes (BIO). The most prevalent causes - biological (BIO), mercury (HG), dissolved oxygen (DO), and Escherichia coli (ECOLI) - vary in frequency among the basins. Management plans by use and basin may be an efficient mode of planning.
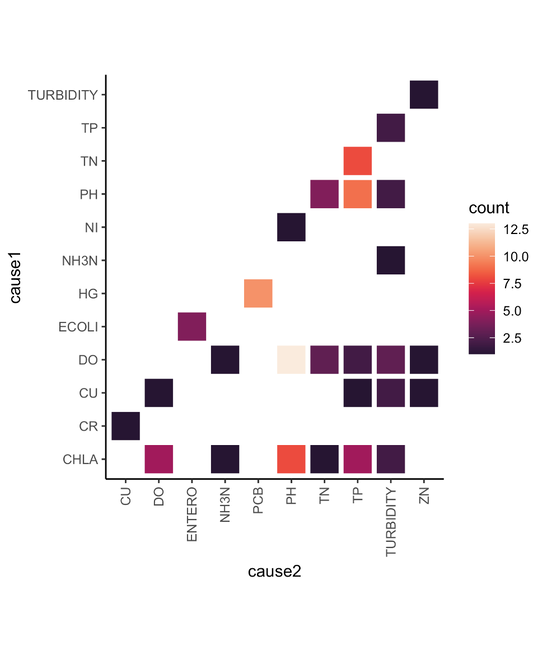
Figure 20. Heat map of the number of water bodies with 2 causes or more attributed to their impairment.
Common pairings of causes include dissolved oxygen (DO) & hydrogen ion concentration (PH), mercury (HG) & polychlorinated biphenyls (PCB), total phosphorus (TP) & total nitrogen (TN), and chlorophyll-a (CHLA) & hydrogen ion concentration (PH). Biological as a cause is missing from this heat map, and it is not listed on the causes in the explanation of the data.
Common pairings of causes include dissolved oxygen (DO) & hydrogen ion concentration (PH), mercury (HG) & polychlorinated biphenyls (PCB), total phosphorus (TP) & total nitrogen (TN), and chlorophyll-a (CHLA) & hydrogen ion concentration (PH). Biological as a cause is missing from this heat map, and it is not listed on the causes in the explanation of the data.
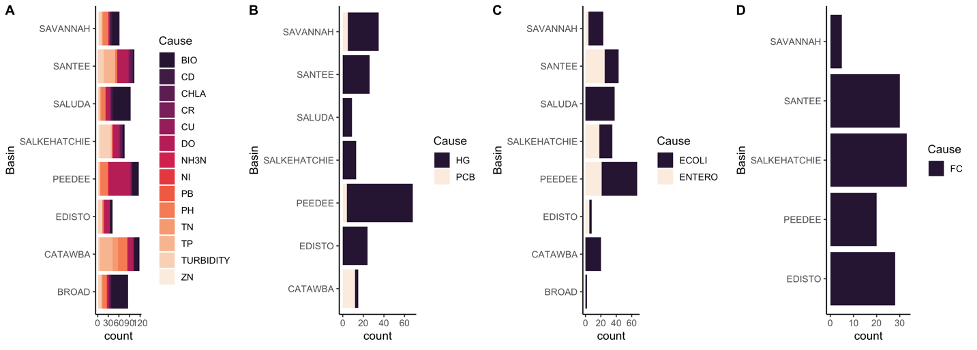
Figure 21. Bar plots depicting various causes associated with each basin. (A) Impaired water bodies listed as “Aquatic Life” under usage. (B) Water bodies listed as “Fish” under usage. (C) Water bodies listed as “Recreational” under usage. (D) Water bodies listed as “Shellfish” under usage.
Water bodies used for aquatic life (Figure 21) display the most variety of causes associated with the different basins. The other three usages, however, have only one or two different causes associated with each basin. Interestingly, every single impaired water body that falls under the “Shellfish” category (Figure 7D.) is associated with fecal coliform bacteria. Fecal coliform bacteria, however, is never listed as a cause for the other usages.
Conclusion:
Our visualizations depict the general trends of priority rankings among basins, use, and cause, and the cause and impairment by use. We found that Catawba has the most near-term priority rankings, as well as the highest percent of impaired water bodies. By use, aquatic life had the most impairments, and was the only use category to have an actively managed water body. Certain causes have higher ratios of near-term priority rankings (rank 2) indicating a higher importance over causes that have only long-term priority ranks (rank 3). The final figure breaks down the different causes by use that classify a water body for impairment. Aquatic life water bodies in 2018 were impaired due to 14 causes, with the vaguest cause being BIO (i.e, biological). Mercury (Hg) and polychlorinated biphenyls (PCB) are the causes of impairment in water bodies used for fish consumption. For recreational use, water body impairment is classified Enterococci (ENTERO) or Escherichia coli (ECOLI). Both are indicators of fecal matter in the water, measures of Enterococci is used at salt water beaches and Escherichia coli at fresh water beaches. Another measure of fecal matter in water is FC, which is fecal coliform bacteria, and is used to classify impairment of water bodies used for shell fish consumption. The Peedee basin has the most impairments due to mercury and recreational impairments due to fecal matter. Future directions of this work could incorporate measurements by cause to classify water bodies that have the most fecal matter in them, across the 3 different measures.
Works Cited
United States Environmental Protection Agency. (2007, June). Homeowners and Agricultural Community Reduce Bacteria Levels in Two Oconee Country Creeks. Report No. 841-F-07-001K.
Marcus, Mike (2020). The State of South Carolina’s 2018 Integrated Report (IR). Retrieved 22 April 2022.
